PROJECT OBJECTIVES
In order to provide safe drinking water to facility staff, each NJARNG site must meet the standards that are set by the New Jersey Safe Drinking Water Act (NJSDWA) and Federal Safe Drinking Water Act (SDWA, 1974).
THEORETICAL BACKGROUND AND PROJECT RATIONALE
The students were tasked with developing a formal sampling plan, and traveled to 29 NJARNG facilities across the state to collect over 200 tap water samples for lead and copper analysis. The students then packaged the results into a formal report, containing site descriptions, methods, results, action plans, tables, and figures created in ArcMap. The faucet locations were entered into a geodatabase, that will be used by DMAVA staff to access and update results for each faucet. A second round of water sampling is scheduled to take place in the Fall of 2018. This project gave the students experience with developing and executing a sampling procedure, collecting water samples, data collection, data organization, formal report writing, and figure making in ArcMap
SUEIP interns have now successfully completed 3 Rounds of water sampling at NJARNG facilities. The recently conducted third round of Water Sampling, which started in FY2019, includes sampling results, faucet location maps, photographs, and recommended action plans. Additionally, follow-up sampling was conducted at the Somerset Armory following kitchen fixture replacements in response to elevated Pb levels identified in Round 1 sampling efforts. Although the kitchen sinks were determined to be below the AL for Pb and Cu, a new bottle filling station located on the drill floor produced Pb concentrations exceeding the AL. SUEIP coordinated with the site armorer to replace the filter. Follow-up samples of this bottle filling station were below the AL for Pb, suggesting that routine filter replacement is an effective procedure for maintaining safe drinking water at these facilities. In total, SUEIP has collected 338 samples from 141 different faucets at 29 facilities, and identified 21 faucets with Pb and/or Cu exceedances. All faucet location data has been entered into the Environmental Sample Location Geodatabase, which can be used to quickly access past results during future sampling
DELIVERABLES
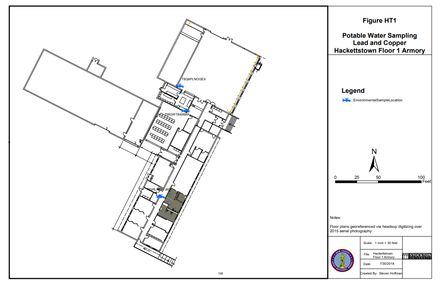
Above is an example figure of a floor plan the interns created with each faucet's sample ID and location. When in ArcMap the information behind each symbol (faucet) can be obtained using the "identifier tool".
|
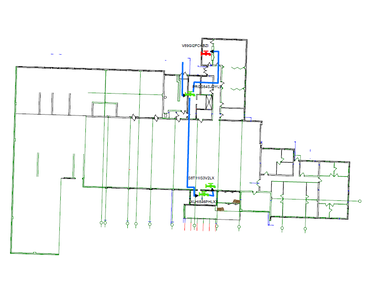
Above is an example figure from round two. The green faucets represent a 'clean' faucet whereas the red faucet represents a 'contaminated' faucet. The blue arrows display the flow of water from the point of entry to each faucet.
|
PHOTOS & VIDEOS OF OUR TEAM MEMBERS
